Your guide to PLG benchmarks
Your guide to PLG benchmarks ATTACH
- It mainly reflects the last mile of the buying process, which feels short-sighted considering that just 5-6% of buying activity is spent meeting with sales reps (data from Gartnerx).
- It assumes that “buyers” hold the power rather than users. Increasingly, end users discover and champion products, then tell their boss what to buy.
- It ignores product and community engagement, aka the experience with the thing that someone is actually purchasing.
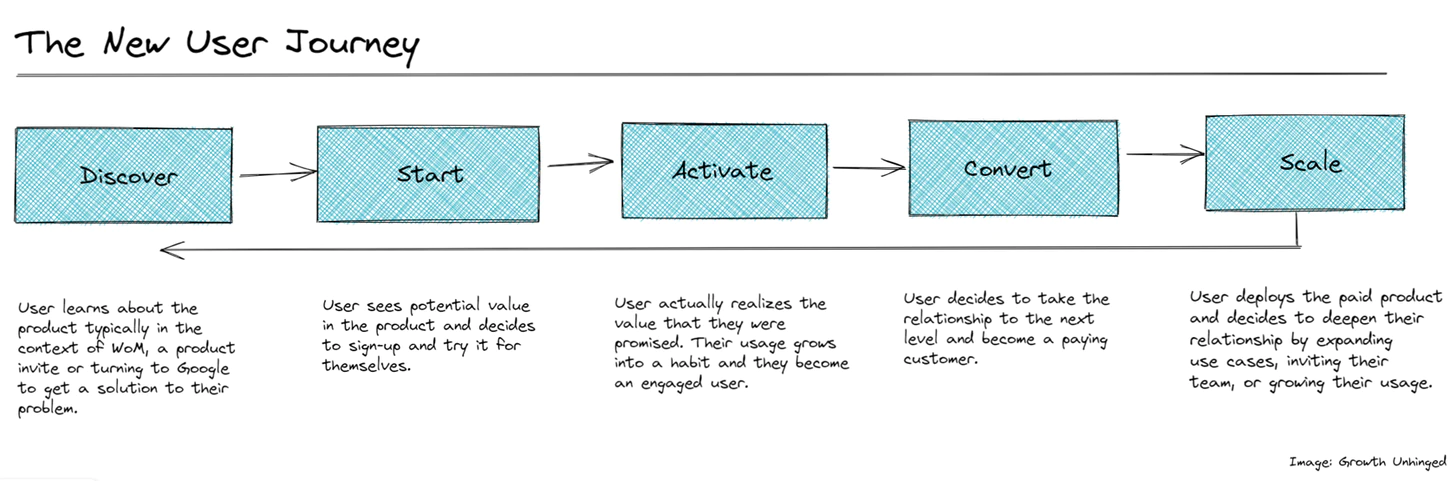
The New User Journey looks something like this:
- Discover
- Start
- Activate
- Convert
- Scale
A few words on who was included in the data:
- Respondents spanned all sizes from <$1M to $100M+ in ARR. 24% of folks had <$1M ARR, 22% had $1-5M, 26% had $5-30M, and the remaining 28% had $30M+.
- More than half (55%) identify as product-led. This is up from 48% in 2020 and 45% in 2019.
- Product-led companies were almost split evenly between offering a free trial or a freemium product as their initial product experience.
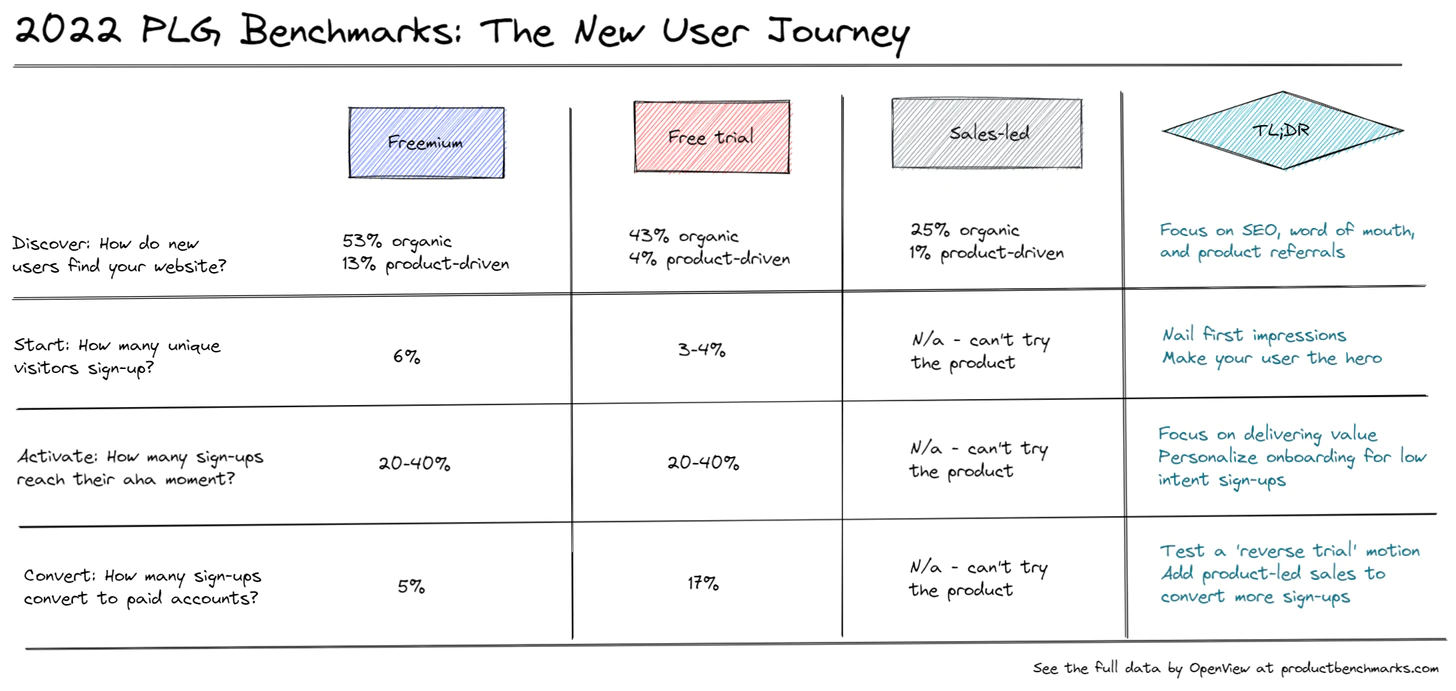
Discover
For freemium companies it’s all about organic sources like SEO and direct traffic (53%) or driven by the product itself (13%). Paid marketing (10%) and outbound sales (8%) play only a small role in PLG user acquisition.
Pro-tip: Invest in product-led marketing campaigns
Start
For every 1,000 website visitors, freemium products get ~60 sign-ups on average (6%). Free trial products get only 30-40 sign-ups (3-4%).
Activate
vast majority of freemium products measure activation (76%), but it’s not mainstream yet for free trial products (58%).
Convert
freemium products convert 5% of their sign-ups—far lower than those with a free-trial motion (17%).
Scale
The average freemium company in our dataset retained only 19% of their sign-ups in month 1, 11% in month 2, and 9% in month 3.