Complete Guide to A/B Testing Design, Implementation and Pitfalls
Complete Guide to A/B Testing Design, Implementation and Pitfalls ATTACH
“The world is a big A/B test” Sean Ellis
if you want to learn or refresh your knowledge in the essential statistical concepts you can check this article: Fundamentals of statistics for Data Scientists and Data Analysts notes: Fundamentals Of Statistics For Data Scientists and Analysts
What is A/B testing and when to use it?
The idea behind A/B Testing is that you show the variated version of the product to a sample of customers (the experimental group) and the existing version of the product to another sample of customers (the control group). Then, the difference in product performance in experimental/treatment versus the control group is tracked, to identify the effect of this new version(s) of the product on the performance of the product.
Benefits of A/B testing
- Allows to learn what works and what doesn’t in a quick manner
- You get feedback directly from actual/real product customers
- Since the users are not aware that they are being tested, the results will be unbiased
Demerits of A/B testing
- Presenting different content/price/features to different customers especially in the same geolocation might potentially be dangerous resulting in Change Aversion (we will discuss how this can be addressed later on)
- Requires a significant amount of Product, Engineering, and Data Science resources
- Might lead to wrong conclusions if not conducted properly
Questions to clarify before any A/B test
- What does a sample population look like and what are the customer segments for the target product?
- Can we find the answer to our business question using exploratory/historical data analysis (e.g. by using causal analysis)?
- Do we want to test single or multiple variants of the target product?
- Can we ensure truly randomized control and experimental groups s.t. both samples are an unbiased and true representation of the true user population?
- Can we ensure the integrity of the treatment vs control effects during the entire duration of the test?
Choice of Primary metric
for the A/B test, we need to tie up the primary metric to the direct and the higher-level goals of the product.
Metric validity question: If this chosen metric were to increase significantly while everything else stays constant, would we achieve our goal and address the problem?
Common A/B test metrics
Click-Through Rate (CTR)
Click-Through Rate
=CTR = {# total clicks * 100%} / {# total clicks + # total veiws}=
Click-Through Probability (CTP)
Click-Through Probability
=CTP = {# poeple with at least 1 ciclk * 100%} / {# number of unique visitors per page}=
Conversion Rate
Conversion Rate defined as the proportion of sessions ending up with a transaction.
=CR = {# converted} / {# converted + # not converted}=
Hypothesis of the test
A/B test should always be based on a Hypothesis that needs to be tested.
For example, if the KPI of the product is to improve the quality of the recommender system’s recommendations and this can be done for example by adding Impression Discounting or building a Re-ranker model for the recommender.
Do not merge multiple ideas into one hypothesis and also limit the variables introduced in the test so that you can understand their individual impact.
Design of the test (Power Analysis)
keeping in mind that it’s not really about testing — it’s about learning.
Step 1: Statistical Hypothesis ATTACH


Step 2: Power Analysis ATTACH
To make sure that our results are repeatable, robust, and can be generalized to the entire population we need to avoid p-hacking, to ensure real statistical significance and to avoid biased results, we want to make sure we collect “enough” amount of observations and we run the test for a minimum predetermined amount of time. Therefore, before running the test we need to determine the sample size of the control and experimental groups and for how long we need to run the test. This process is often referred to as Power Analysis and it includes 3 specific steps: determining the power of the test, determining the significance level of the test, and determining a Minimum Detectable Effect.
Power of the test
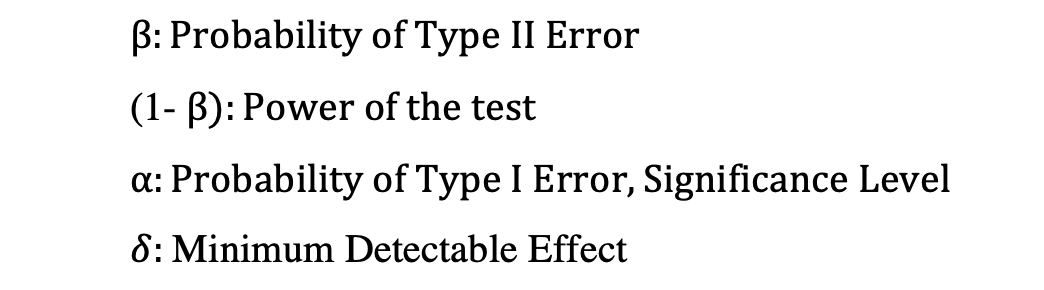
Power of a Test is the probability of correctly rejecting the Null Hypothesis. The power, often defined by (1-beta) is equal to the probability of not making a Type II Error, where Type II error is the probability of not rejecting the null hypothesis while the null is false.
It’s common practice to pick 80% as the power of the A/B test, that is 20% Type II error which means that we are fine with not detecting (failing to reject the null) a treatment effect while there is an effect.
Significance level of the test
Significance Level which is also the probability of Type I Error is the likelihood of rejecting the null, hence detecting a treatment effect, while the null is true and there is no statistically significant impact.
Generally, we use the significance value of 5% which indicates that we have a 5% risk of concluding that there exists a statistically significant difference between the experimental and control variant performances when there is no actual difference.
Minimum Detectable Effect (delta)
Minimum Detectable Effect what is the substantive to the statistical significance that the business wants to see as a minimum impact of the new version to find this variant investment-worthy?
MDE is a proxy that relates to the smallest effect that would matter in practice for the business and is usually set by stakeholders.
It’s common practice to pick 80% as the power and 5% as the significance level of the A/B test, that is 20% Type II error and 5% Type I error. However, the choice of a value of this parameter depends on the nature of the test and the business constraints.
Step 3: Calculating minimum sample size
Calculation of the sample size depends on the underlying primary metric that you have chosen for tracking the progress of the control and experimental versions.
Case 1: Sample Size Calculation with Binary Metric ATTACH
When we are dealing with a primary performance tracking metric that has two possible values such as the Click Through Rate where the user can either click (success) or not click (failure) and if the users’ responses to the product can be defined as “independent” events then we can consider this as Bernoulli Trials where the click event (success) occurs with probability p_con in case of the Control Group and p_exp in case of the Experimental Group.
Then the sample size needed to compare these two Binomial Proportions, using a two-sided test with prespecified significance level, power level, MID can be calculated as follows:
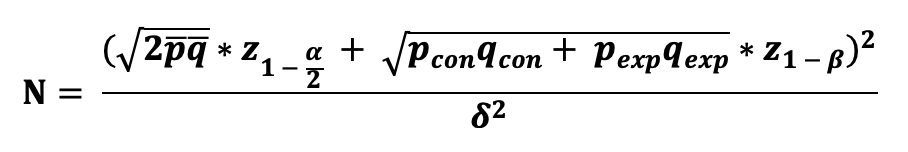
where we need to use A/A testing (an A/B test except assigning the same treatment to both groups) to obtain the estimates for p_bar and q_bar.
Case 2: Sample Size Calculation with Continuous Metric ATTACH
When we are dealing with a primary performance tracking metric that is in the form of an average such as the mean order amount where we intend to compare the means of the Control and Experimental Groups, then we can use the Central Limit Theorem and state that the mean sampling distribution of both Control and Experimental Groups follow Normal Distribution.
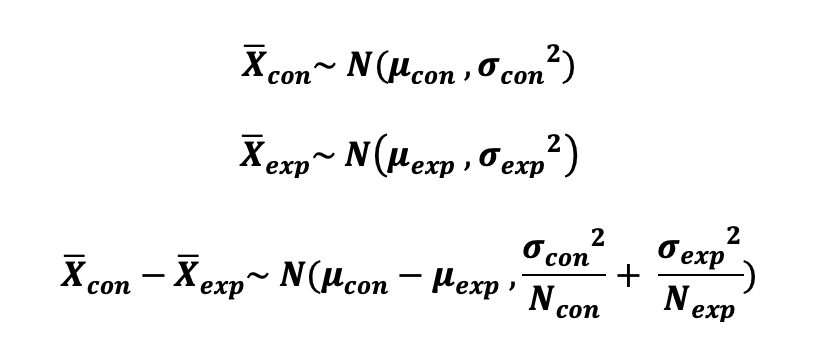
Hence, the sample size needed to compare the means of two Normally Distributed Samples, using a two-sided test with prespecified significance level, power level, MID can be calculated as follows:
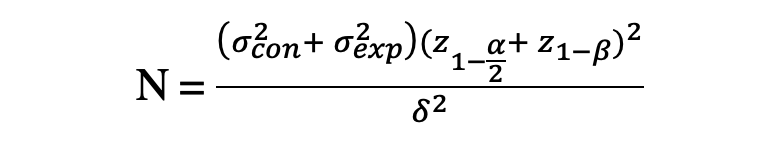
where we can run an A/A test to obtain the sample variances, σ²_con, and σ²_exp.
Step 4: Determining A/B test duration
To determine the baseline of a duration time, a common approach is to use the following formula: Duration = {N} / {# visitors per day}
Too small test duration: Novelty Effects
when picking a test duration we need to make sure we don’t run the test for too short a time period otherwise we can have a Novelty Effects.
Too large test duration: Maturation Effects
the longer the test period the larger is the likelihood of external effects impacting the reaction of the users and possibly contaminating the test results, Maturation Effects.
Running the A/B test
Analysing A/B test results in Python
This set includes:
- Choosing an appropriate statistical test
- Calculating the test statistics (T)
- Calculating the p-value of the test statistics
- Reject or fail to reject the statistical hypothesis (statistical significance)
- Calculate the margin of error (external validity of the experiment)
- Calculate confidence interval (external validity and practical significance of the experiment)
Choosing an appropriate statistical test
Once the interaction data of the Control and Experimental groups are collected, you can test the statistical hypothesis earlier by choosing an appropriate statistical test that is usually categorized in Parametric Statistics and Non-Parametric Statistics tests. The choice of the test depends on the following factors:
- format of the primary metric (underlying pdf)
- sample size (for CLT)
- nature of the statistical hypothesis (show that a relationship between two groups merely exists or identify the type of relationship between the groups)
The most popular Parametric Statistics tests that are used in A/B testing are:
- 2 Sample T-test (when N < 30, metric follows student-t distribution, and you want to identify whether there exist a relationship and the type of relationship between control and experimental groups)
- 2 Sample Z-test (when N > 30, metric follows asymptotic Normal distribution and you want to identify whether there exist a relationship and the type of relationship between control and experimental groups)
The most popular Non-Parametric Statistics tests that are used in A/B testing are:
- Fisher’s Exact Test (small N, identify and you want to identify whether there exist a relationship between control and experimental groups)
- Chi-squared Test (large N, identify and you want to identify whether there exist a relationship between control and experimental groups)
- Wilcoxon Rank Sum/Mann Whitney test (small N or large N, skewed sampling distributions, testing the difference in medians between control and experimental groups)
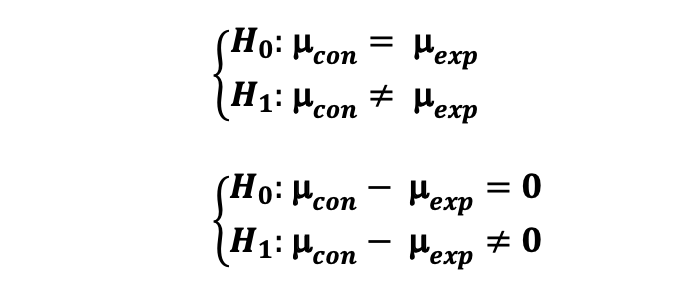
2 Sample T-test ATTACH
2 Sample T-test If you want to test whether there is a statistically significant difference between the control and experimental groups’ metrics that are in the form of averages (e.g. average purchase amount), metric follows student-t distribution and when the sample size is smaller than 30, you can use 2-sample T-test to test the following hypothesis:
import numpy as np
from scipy.stats import t

N_con = 20
df_con = N_con - 1 # degrees of freedom of Control
N_exp = 20
df_exp = N_exp - 1 # degrees of freedom of Experimental

# Significance level
alpha = 0.05

# data of control group with t-distribution
X_con = np.random.standard_t(df_con,N_con)
# data of experimental group with t-distribution
X_exp = np.random.standard_t(df_exp,N_exp)

# mean of control
mu_con = np.mean(X_con)
# mean of experimental
mu_exp = np.mean(X_exp)

# variance of control
sigma_sqr_con = np.var(X_con)
#variance of control
sigma_sqr_exp = np.var(X_exp)

# pooled variance
pooled_variance_t_test = ((N_con-1)*sigma_sqr_con + (N_exp -1) * sigma_sqr_exp)/(N_con + N_exp-2)*(1/N_con + 1/N_exp)

# Standard Error
SE = np.sqrt(pooled_variance_t_test)

# Test Statistics
T = (mu_con-mu_exp)/SE

# Critical value for two sided 2 sample t-test
t_crit = t.ppf(1-alpha/2, N_con + N_exp - 2)

# P-value of the two sided T-test using t-distribution and its symmetric property
p_value = t.sf(T, N_con + N_exp - 2)*2

# Margin of Error
margin_error = t_crit * SE
# Confidence Interval
CI = [(mu_con-mu_exp) - margin_error, (mu_con-mu_exp) + margin_error]

print("T-score: ", T)
print("T-critical: ", t_crit)
print("P_value: ", p_value)
print("Confidence Interval of 2 sample Z-test: ", np.round(CI,2))
return T, t_crit, p_value, np.round(CI,2)